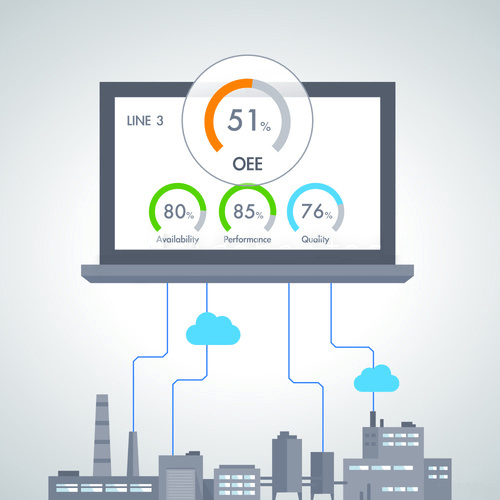
Calculating and monitoring OEE (Overall Equipment Efficiency) on a board at all levels, such as machine, supervisor, department and shop floor level, can be complicated. Especially if you are running manual time studies and recording on paper or it is not possible to connect through APIs to PLCs and machines.
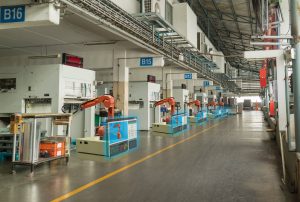
Production lines with many machines would need a small army of monitors to track uptime and downtime as operators concentrate on performing their tasks. And then mathematics should be added and updated regularly.
SCADA systems may have some built-in functionality to report on OEE panels. But these systems are not designed with end users in mind. As a result, configuring the display of the most elementary indicators can be extremely complicated.
Digital dashboards and BI solutions provide a middle ground, eliminating the burden of collecting and analyzing OEE data manually without the complexity of production systems.
By allowing you to connect data streams to visualizations without having to write any code, digital dashboards transform the way you measure OEE and help you gain more insight into the production process.
However, the value of OEE is diagnostic and not the solution to the problems. It provides an overview of the various factors that contribute to operational efficiency. To get the most out of OEE, you must combine it with other metrics and operational meetings.
Historical OEE
Dashboards can display OEE data in real time, daily, quarterly and other cadences. This allows you to see if there are persistent problem areas and can help you track whether or not your improvements are making a difference. When you combine time data with machine type, machine OEE by type or by program, or even by production shift you can get a detailed view of production.
Detailed analysis of OEE
Panels allow you to place different types of data side by side, making it possible to gain new insights. For example, you can display paretos next to OEE to see the most common causes of downtime and quality defects together. You can also place OEE next to a performance tracker to view targets, track the progress of changes, and gather information about the data for reporting and data-driven decision making.
OEE focused on human capital
Often, low OEE is not the result of poor production line performance. Is the result of human activity around a machine or ignorance of its operation, OEE dashboards can help you gather the reasons for downtime, changeover times, tool condition and other human-centric metrics to help you determine the root cause of low efficiency and you should make the decision what management changes are needed.
(Source: Tulip; Silcon)
Consult our technical support
here
.